Discover latest facts & figures on the development of gender diversity in the Swiss workplace. Benefit from deep insights into current challenges and their causes combined with hands-on recommendations.

This year we present the GIR Key Performance Indicators, a set of KPIs that allow readers to get a snapshot of gender equity in Swiss business. From now on, these key figures will be your constant companion through every year’s GIR. With that in mind, it’s time to get back to fixing the “leaky pipeline.”
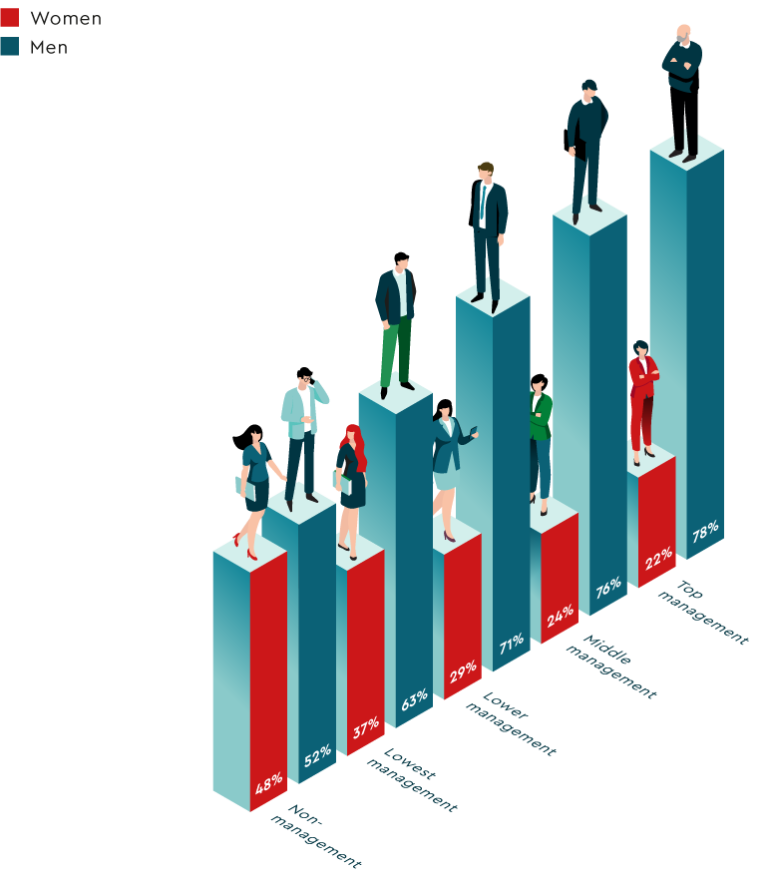
A look at the gender distribution at all management levels reveals clearly: Participating companies still have a long way to go when it comes to gender parity in the workplace.
The leaky pipeline, where women are (nearly) equally represented in non-management yet barely represented in top management positions, has been a fixture in the Gender Intelligence Report every year. 2023 is no exception. Although women hold 48% of non-management positions, they are only represented at 22% in top management.
To show progress over time and allow for accurate comparability, a sub-sample has been created of 74 companies with 339,5000 employees’ HR data from companies that have participated in the report in both 2022 and 2023.
Top management
+3 percentage points
Middle management
+1 percentage point
Lower management
0 percentage points
Lowest management
+2 percentage points
Management overall
+1 percentage point
Looking at management as a whole, the percentage of women between 2022 and 2023 increased by 1 percentage point. Looking at the different management levels, we see that the share of women increased by 2 percentage points in lowest management, by 1 percentage point in middle management and by 3 percentage points in top management. However, in lower management no progress was made. This means there is barely any progress except for top management.
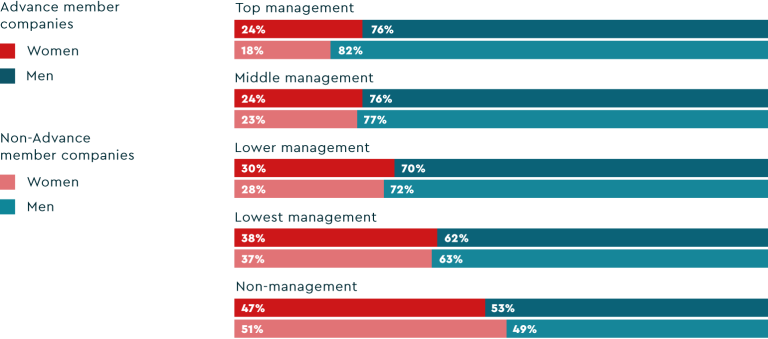
Advance members do better than non-Advance members regarding the share of women at each management level. In top management, women at Advance member companies have a representation of 24%, and only 18% in non-Advance companies. However, the pattern is the same in all companies, and the share of women decreases at each management level.
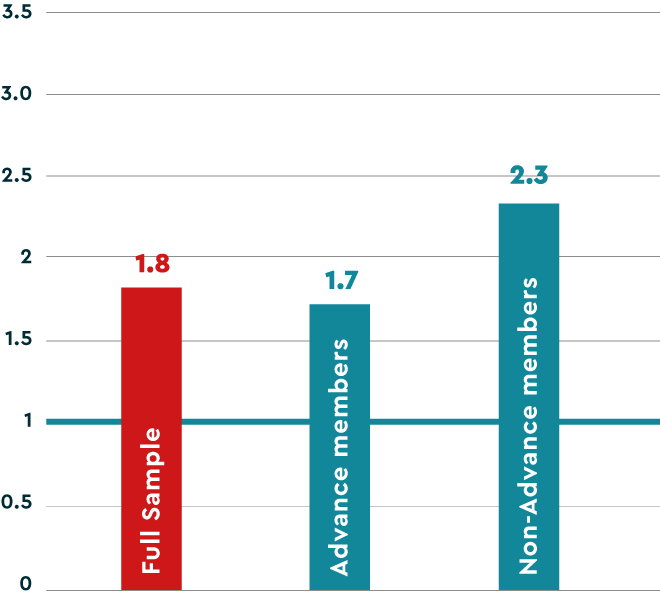
When compared to men, if women are represented in similar proportions across all hierarchy levels they can reach management positions without significant hurdles. The Glass Ceiling Index compares the gender distribution in management (or at a specific management level) with the gender distribution in the overall workforce. A GCI of 2 would indicate that the overrepresentation of men at a particular management level doubles when compared to the representation of women. If men are represented at a ratio of 1:1.5 in the overall workforce (e.g., 40% to 60%), then at a specific management level men are represented at a ratio of 1:3 (e.g., 25% to 75%).
A GCI of 1 is optimal and means that women are represented at a given management level in proportion to their representation in the overall workforce. This optimal value means no female talent is lost on the way up, and potential is fully realized. If the index is above 1, women are underrepresented (compared to their share of the total workforce) at a particular level. The higher the value, the more significant the hurdles for women and the loss of talent potential.
The GCI demonstrates that women are underrepresented in middle and top management positions across the board. This is considerably more pronounced in non-Advance than Advance companies.
When looking at the development between 2022 and 2023, there is no change in the GCI. Thus, women in 2023 remain as underrepresented in middle and top management as in 2022.
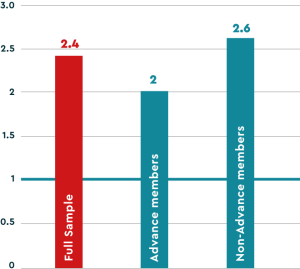
In addition to the Glass Ceiling Index, the “Power Index” compares the gender distribution in positions with personnel responsibility compared to the gender distribution in the overall workforce. The higher this index, the more underrepresented women are in positions with real influence and decision-making power.
The Power Index shows there is still a way to go until women are equally represented in positions of power. Like the GCI, Advance members seem to do a better job than non-Advance members when it comes to elevating women into influential positions. The Power Index also stayed the same between 2022 and 2023.
Through promotions and hiring, companies can lay the groundwork for building up a female talent pipeline.
Compared with their overall share of employees, men are promoted at a higher rate than women. With 40% of the total average workforce in the sample being female, only 37% of promotions go to women.
In management positions, hiring trends are somewhat positive: 36% of new hires are women compared to 30% already employed in management. However, while both new hires and promotions contribute to increasing the share of women in management, the share of promotions at 37% is considerably lower than the share of women in non-management, which indicates that the talent pipeline is not utilized well.
However, women are less likely to be hired into management roles when compared to their overall share in the workforce. Thus, the same trend holds for management hires and promotions: They contribute to increasing the share of women in management, but the diverse talent pipeline remains underutilized.
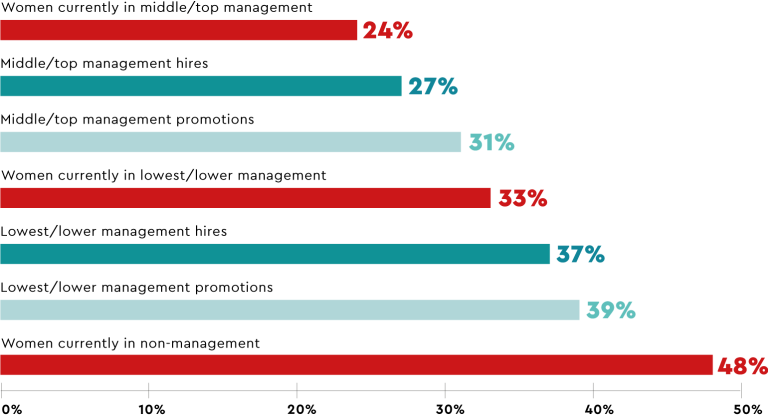
What does a closer look at hires and promotions at different management levels reveal about how companies are (under-)utilizing their diverse talent pipelines? Though leaky, the pipeline is bursting with diverse potential. Especially when it comes to the step from non-management to lower management levels, there is much potential that companies don’t utilize yet.
While women make up 48% of non-management, only 39% of lowest and lower management promotions are women. In lowest and lower management, the percentage of women is 33%.
It’s a bit better when looking at middle and top management promotions. Their share among promotions to higher management levels is 31%, showing that the talent pool is relatively well utilized here (though women remain underrepresented). In higher management levels, companies are somewhat increasing the share of women through promotions and new hires.
These tendencies are even more pronounced in recruitment, indicating that companies underutilize hires to increase the share of women especially for middle/top management.
Women in middle/top management
+1 percentage point
Middle/top management hires
+3 percentage points
Middle/top management promotions
+4 percentage points
Women in lowest/lower management
+1 percentage point
Lowest/lower management hires
+1 percentage point
Lowest/lower management promotions
+3 percentage points
Women in non-management
0 percentage points
Progress between 2022 and 2023 regarding the percentage of women in management as a whole is minimal at one percentage point. If we look at personnel movements at different management levels, slightly more progress is noticeable, especially when it comes to promotions. The percentage of women in lowest/lower management promotions increased by three percentage points, the one in middle/top management promotions even by four percentage points. However, not the same can be said for recruitment: Hires for lowest/lower management only increased by one percentage point. Those for middle/top management again show more progress with an increase of 3 percentage points.
Starting around age 30, men gain an advantage over women. This life period can therefore be viewed as a “career killer” for women and a “career accelerator” for men. While the promotion rates of men and women are relatively balanced between 21 and 30, men are much more likely to be promoted between 31 and 40. Between 41 and 50, men are twice as likely as women to be promoted.
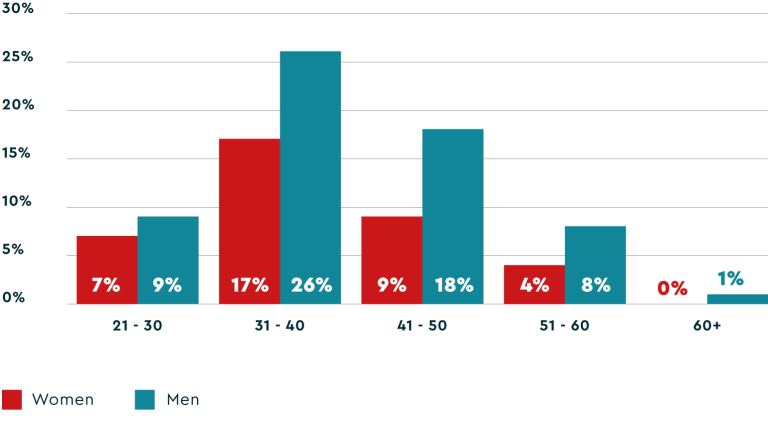
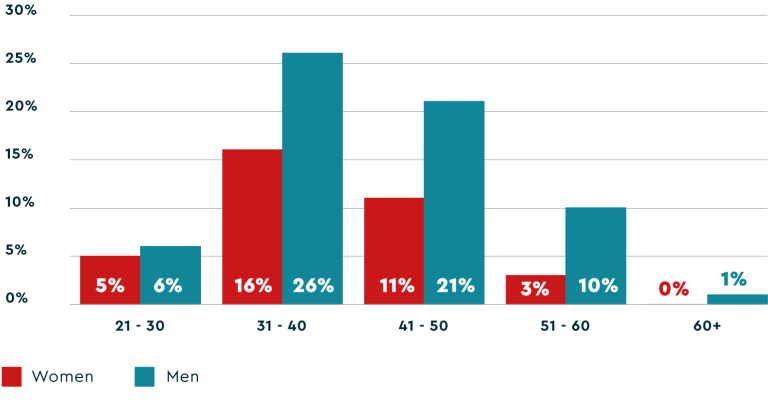
The same tendency holds for management hires. The gap between men’s and women’s hiring rates widens from 31 to 40 and remains open for the rest of their careers.
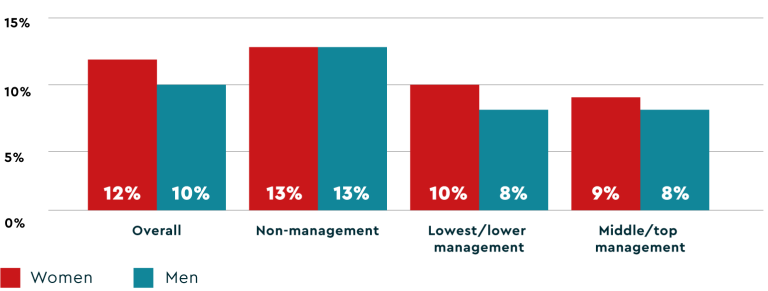
Overall, the attrition rate of women is 12%, and that of men is 10%. In the key “springboard level” of lowest and lower management, this 2-percentage-point gap is also apparent. Are the attrition rates of women higher at these levels because they have fewer chances for promotions (and thus opt to leave)? Or do they have better chances in the labor market and are thus more likely to leave their employer for better opportunities? Since women are disproportionately less likely to be hired at all management levels, it seems likely that the latter question is not the case.
As seen below, the attrition rate is the ratio of exits to the number of employees at the end of the previous year plus new hires. The higher the attrition rate, the higher the share of employees of a certain group who are leaving!
Men work at higher employment percentages (full-time or nearly full-time) at all hierarchical levels. At the same time, women are much more likely to work part-time (though the higher the management level, the closer women’s employment percentages edge towards men’s). Therefore, women must likely increase their employment rate to achieve a higher level, which can be challenging due to timing.
Right around “family primetime,” women decrease their employment percentages. This timing coincides with the age group where most promotions happen, between ages 31 and 40 (43% of promotions go to employees in this age group).
There is no significant change in average employment percentages between 2022 and 2023. For almost all management levels and age groups, the changes are between 0 and 1 percentage point for women and men.
Every year, we want to know: How are Swiss companies championing I&D? What are Swiss organizations doing to build inclusive cultures and foster inclusive leadership?
Are most Swiss organizations currently prioritizing diversity and inclusion? The short answer – it depends. The fact that only about half of companies have inclusion anchored as part of their corporate strategy, or even their I&D strategy, signals that inclusion is very much considered an HR issue in Swiss business.
More companies feature diversity than inclusion as part of their HR strategy, I&D strategy, corporate strategy, or all the above. Only 37% explicitly tie diversity into their mission statement, demonstrating that they consider it a part of their core purpose. This difference in strategy and statement signals a stronger understanding that diversity is key to business success. However, the awareness that diversity cannot thrive without inclusion has not yet been established in many companies.

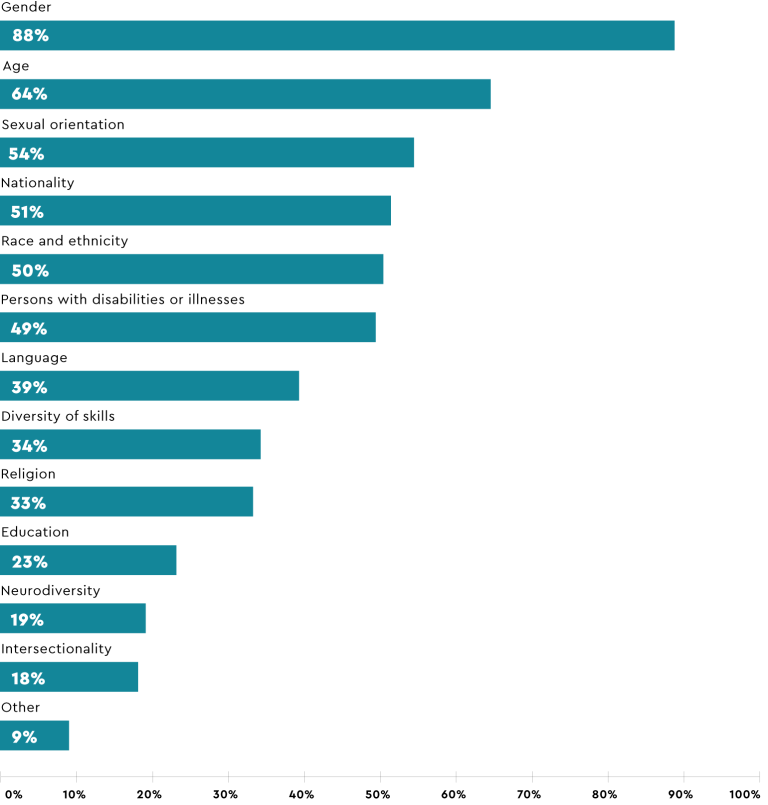
Looking at the diversity dimensions explicitly named in GIR companies’ strategies provides insight into what dimensions are the focus of I&D efforts in different companies. For instance, 88% of companies explicitly mention gender diversity and 64% mention age, yet only half mention race & ethnicity and only 39% mention language diversity (even though this is an important topic in multi-lingual Switzerland).
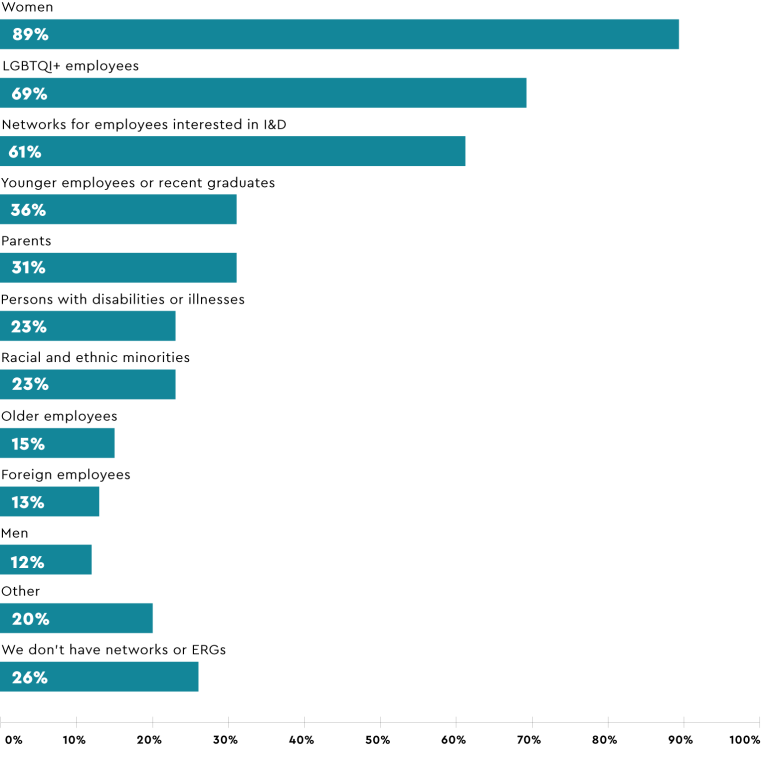
Trends in I&D networks and employee resource groups follow a very similar pattern. Most companies have groups for women, while less than a quarter have networks for racial and ethnic minorities. Notably, over 25% of GIR companies don’t have any employee networks or resource groups (which might be due to some GIR companies’ smaller size).
68% of companies have measurable, overall inclusion goals. While this number may seem high, it is still lower than those companies with measurable diversity goals (79%). Companies focusing on diversity goals without the combination of inclusion goals may promote assimilation into the old organizational culture, rather than a sense of value and belonging for diverse employees (Shore et al., 2011).
What gets measured gets done. It is heartening that the same share of companies with diversity goals also have regular I&D reporting.
Through their goals, managers are the levers in fostering a diverse, inclusive workforce. Inclusion goals for managers may include proven conflict resolution skills, participation in inclusion trainings (e.g., psychological safety or inclusive leadership), team-level engagement survey results related to inclusion, etc. Leaders need to be held accountable for achieving these goals. Managers should not be surprised on their success when it comes time for performance reviews. Diversity goals hold managers accountable for diversity in their teams and units. Yet only 34% of companies have measurable inclusion goals for managers, and 44% of GIR companies have diversity goals. If not managers, who are responsible for achieving organization-wide I&D goals?
Nearly all GIR companies offer unconscious bias trainings for managers and HR professionals, and almost two-thirds offer selfsame for employees at large. In this way, companies are laying important groundwork for effecting change towards an inclusive culture and awareness among leaders and employees. But what about processes? Do companies have in place inclusive processes to support the needs of all diverse employees? One such example is flex-work options.
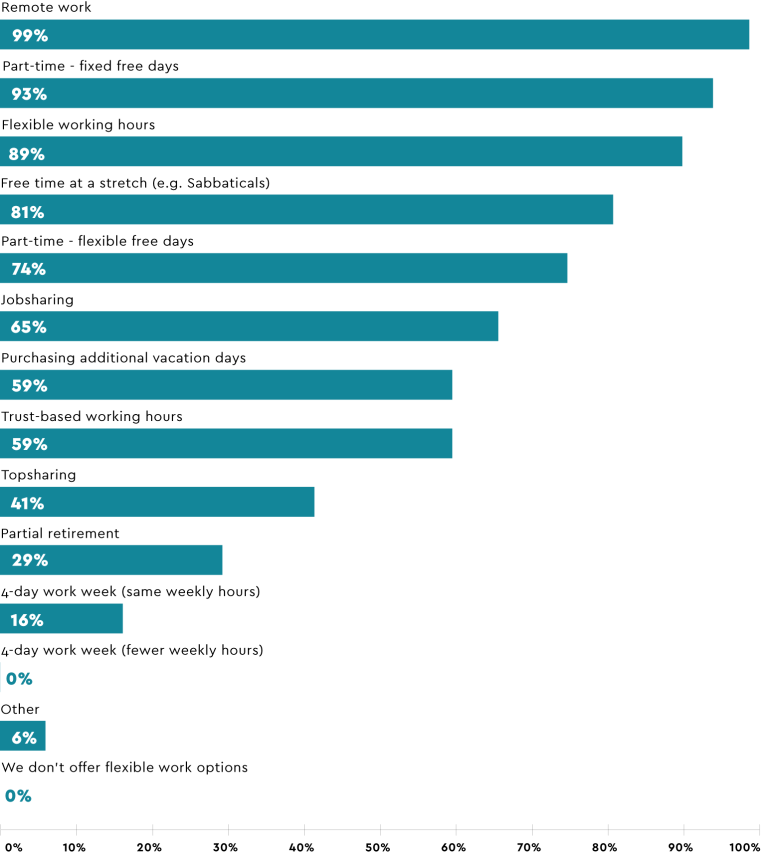
Unsurprisingly post-Covid, 99% of GIR companies allow their employees to work remotely. In 93% of companies, fixed part-time days are possible, and sabbaticals are common.
While 65% of companies offer jobsharing for non-leadership positions, only 41% offer topsharing. This difference shows that leadership is still considered a one-person, full-time job. And in contrast to many other European countries, the four-day workweek has barely found a foothold in Switzerland (yet).
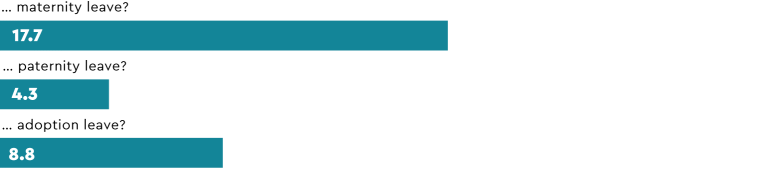
The average GIR company offers more parental leave than is legally required: 17.7 weeks for mothers, 4.3 weeks for fathers, and 8.8 weeks for adoption. The 13.4-week contrast between maternity and paternity leave signals that Swiss businesses maintain a conservative attitude towards caregiving and provider roles for men and women. This conservative attitude reflects in legal structures as well. Only 16% of GIR companies offer parental leave (i.e., shared leave entitlement).
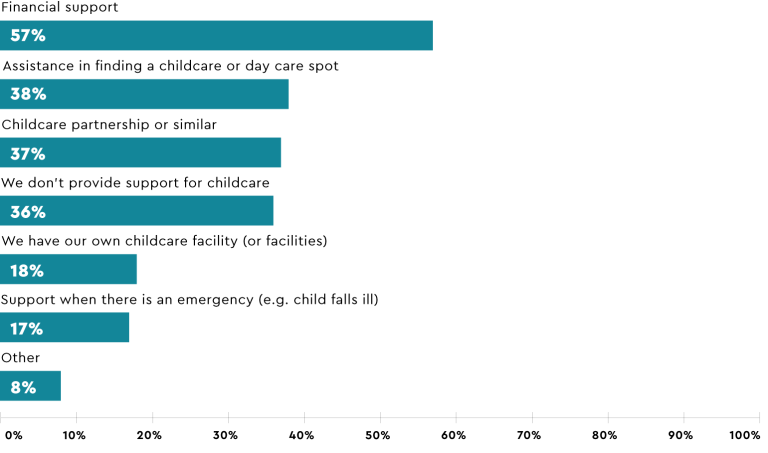
36% of GIR companies do not support their employees’ childcare in any way, even though Switzerland has a particularly expensive and complex childcare system. Among companies that do provide support, 57% provide financial support. Only 18% of GIR companies have their own childcare facility.
While it seems to become more commonplace to anchor inclusion and diversity in companies’ DNA, GIR companies show little progress when it comes to gender diversity. What is holding companies – and women – back? In this year’s GIR, we call on companies to leverage all of their diverse talents, change the way work is done and support employees to share the care. These measures will not only help women advance, but also contribute to combat skills shortage.