Key Findings 2022 Recommendations 2022
Key Findings 2022 Recommendations 2022
Hurdles persist across all industries regarding women making it to the top – for some industries, they are steep. Yet, key differences persist across industries as to the size of these hurdles. These hurdles are illustrated by the Glass Ceiling Index (GCI).
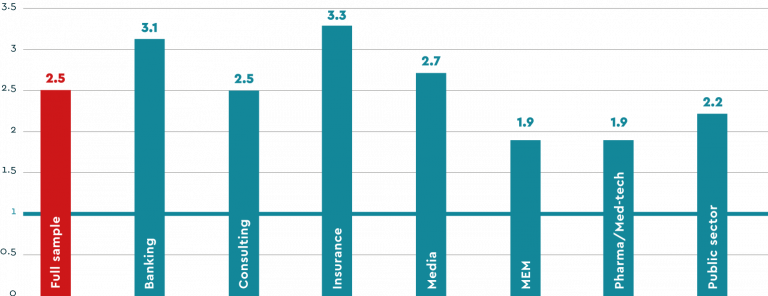
The GCI for middle and top management shows clearly: The hurdles to reach middle and top management positions are highest for women in the Banking and Insurance industry and lowest in Pharma/Med-tech and the MEM industry.
If women are represented with similar proportions across all hierarchy levels, they can reach management positions without significant hurdles compared to men. The Glass Ceiling Index compares the gender distribution in management (or at a specific management level) with the gender distribution in the overall workforce. A Glass Ceiling Index of 2 would indicate that the overrepresentation of men at a certain management level doubles (compared to the representation of women). If men were represented at a ratio of 1:1.5 in the overall workforce (e.g., 40% to 60%), they are represented at a ratio of 1:3 (e.g., 25% to 75%) a this specific management level.
A Glass Ceiling Index of 1 is optimal and means that women are represented at a given management level in proportion to their representation in the overall workforce. This means that no female talent is lost on the way up, and the potential is fully realized. If the index is above 1, women are underrepresented (compared to their share of the total workforce) at a particular level. The higher the value, the greater the hurdles for women and the loss of talent potential.
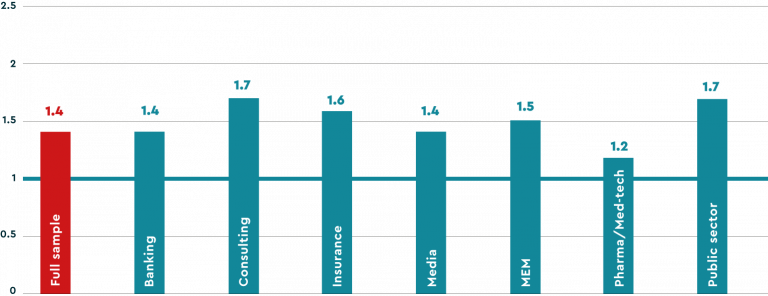
The GCI for lower and lowest management is lower and much more similar across industries. Hurdles for women to reach these lower management levels are therefore less significant.
Here, too, the Pharma/Med-tech industry is leading the charge when it comes to female representation in lowest and lower management: Barely any hurdles exist.
While women are better represented in lowest and lower management than in middle and top management, this does not necessarily mean that the talent pipeline is really filling up with diverse talents. Often, women are promoted into nominal management positions (expert or higher level administrative/back-office positions) where they have little responsibility over personnel or profit & loss and receive little visibility. These are not true “springboard” positions that will catapult women all the way to the top. Considering the overall sample, women’s share of positions with personnel responsibility remains between 10% and 15% on the various management levels, whereas men’s share increases consistently with each higher level.
Also in line with this pattern: the share of personnel responsibility positions in lower and lowest management is lowest in Banking, Insurance, and Pharma/Med-tech, though in Pharma/Med-tech, the share of positions with personnel responsibility is lower in middle and top management as well (it seems possible to attain a high management level on an expert management track, too). And: Banking and Insurance have particularly high obstacles to attain middle and top management positions.
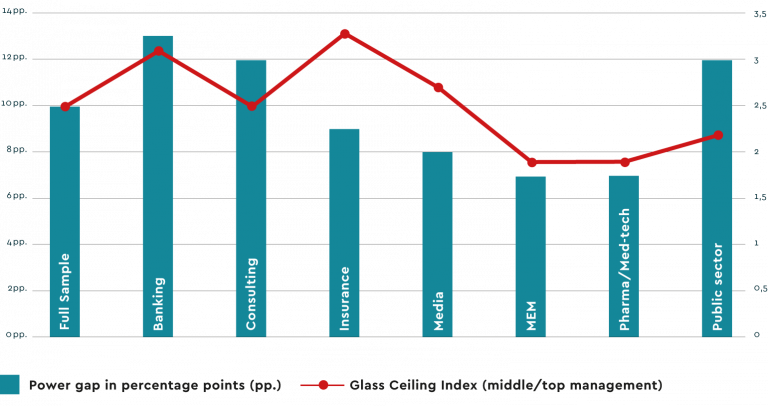
That women are less well represented in positions with power is also represented in the so-called “power gap”, which shows the difference between the proportion of men with personnel responsibility (in relation to all men) and the proportion of women with personnel responsibility (in relation to all women). Looking at the industry spread in this respect reveals interesting differences. With the exception of the Insurance industry and the Public sector, the power gap reflects the Glass Ceiling Index curve. While we see one of the lowest power gaps at 7 percentage points in the MEM and Pharma/Med-tech industries – both demonstrating a good GCI – the gap is biggest in Banking at 13 percentage points.
In almost all industries, the internal development of talent is more important than external recruitment for both genders. This means that more key career steps can be made through internal development (promotions) than external hires.
Who gets promoted? In short: The “typical talent” that advances internally is a 31 to 40 year old man, Swiss, educated with a tertiary degree, and who works full time. There is not a single industry where the female share of promotions reaches 50%. The Banking, Consulting, and MEM industries promote between two-thirds and three-quarters of men. The Insurance industry, Media, Pharma/Med-tech, and the Public sector promote below 60% men. The overall share of women among promoted employees is highest in the Public sector at 45%.
Industries are using promotions to increase the share of women in lowest and lower management with varying success. For example, in the Banking industry, the female representation among promotions to this level is 33%, and thus only slightly higher than the existing 30% of women in lowest and lower management. The same is true for the Consulting industry, Pharma/Med-tech, and the Public Sector, where promotions barely move the (diversity) needle (it should be noted that the share of women in lowest and lower management in Pharma/Med-tech and the Public sector is higher to begin with).
On the other hand, the MEM industry, Insurance, and (most of all) Media are utilizing promotions to increase the share of women in lower and lowest management, contributing to a diversifying talent pipeline in “springboard positions.”
But this number alone tells us little about how well different industries are using their gender-diverse internal talent pipelines. The talent pipeline for lowest and lower management positions are non-management employees. By comparing the female promotion rates in lowest and lower management to non-management, we can gain valuable insights into how well a given industry utilizes its diverse talents.
The MEM industry is doing a lot with little: It is utilizing the relatively few female talents in non-management to increase the share of women in lowest and lower management. In fact, only the MEM (despite NOT having a gender-diverse talent pipeline) and the Media industries are promoting women at a similar or higher rate than their representation in non-management. They are using their internal talent pipelines well. All other industries promote women at lower rates compared to their representation in non-management.
The difference between women’s promotion rates and women’s representation in non-management is particularly strong in the Banking and Insurance industries, and the Public sector. These industries are not utilizing their diverse talent base well when it comes to internally advancing women’s careers.
Promotions serve to increase the share of women in middle and top management in all industries. But also, with promotions to these upper management levels, differences between the industries exist. Overall, the different industries are better utilizing internal development to increase the share of women at the top, though it is important to keep in mind that the existing share of women in these positions is very low, to begin with.
Yet, only about half of all industries are (nearly) proportionally utilizing their diverse talent pipeline in lowest and lower management when it comes to promoting in middle and top management: The MEM industry, Media, Pharma/Med-tech and the Public sector. The gap between female talent pipeline and middle and top management promotions is particularly high in the Consulting and Insurance industries.
What is striking: Only the MEM and Media industries proportionally utilize their diverse talent pipeline for internal development across all management levels.
Of course, industries can also increase their gender diversity in management through external hires, though this should not be a substitute to internal sustainable talent management – more of a supplement.
All industries are using new hires to contribute to the diversity of a given management level. For the lowest and lower management level, this is particularly pronounced for Consulting, the MEM industry, and – above all – the Public sector. For middle and top management, the Consulting and Insurance industries and once again the Public sector are utilizing external recruitment particularly well to increase the share of women.
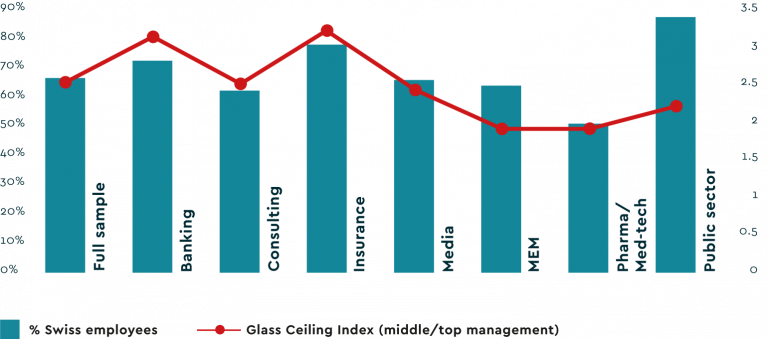
It is striking to see that more “Swiss” (in terms of numbers of employees) goes along with a less proportionate talent management when it comes to bringing women into upper management roles. This indicates that the Swiss culture continues to pose difficulties for women to thrive in management careers.
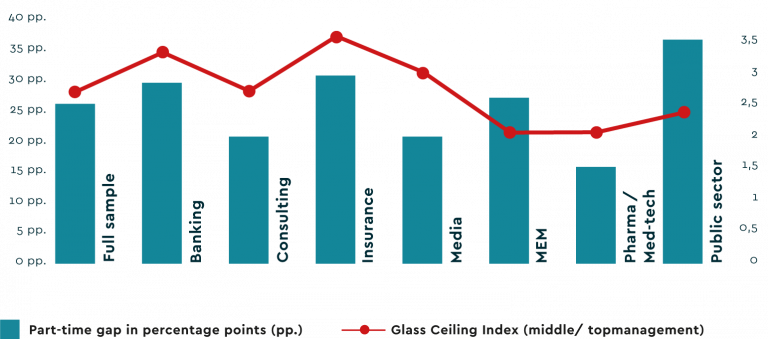
For example: The Banking and Insurance industries have a high share of Swiss employees and the highest Glass Ceiling Index for middle and top management. The MEM and Pharma/Med-tech industries have lower levels of Swiss employees and fewer obstacles at the top.
The very common part-time employment among Swiss women may likely contribute to the result shown in the figure above. Data shows that Swiss women work substantially more often part-time (and in lower employment percentages) than non-Swiss women. Part-time, however, is not conducive for a management career. In (higher) management levels, full-time is clearly the norm in Switzerland. Interestingly, the Glass Ceiling Index tends to look worse in those industries with a bigger part-time gap. The part-time gap shows the difference between the proportion of women who work part-time (in relation to all women) and the proportion of men who work part-time (in relation to all men).
Women seem to face more obstacles if they routinely reduce their employment percentage around “family primetime,” which coincides with when most promotions/career steps take place. On average, women reduce their employment percentage between the age groups of 25-35 and 36-45 by seven percentage points.
The I&D questionnaire yields insight into what performing industries are doing differently and what the key to success might be. The following insights are derived from what proves to work in organizations and industries with a good Glass Ceiling Index and a high degree of diverse talent utilization.
Pharma/Med-tech, as the industry with the best Glass Ceiling Index overall, in middle and top management and in lower and lowest management, stands out in championing inclusion in nearly every key performance indicator relevant for I&D performance: