This report applies the term “power positions” to roles with the power to make key decisions, plot strategy, steer financial flows, and influence a wider circle of stakeholders. Such roles are measured by the indicator “personnel responsibility” in the data analyzed, as such roles are likely also to comprise profit and loss responsibility and are often career-critical.
Not even half of all management positions come with personnel responsibility. It is therefore important to analyze positions with personnel responsibility in addition to management positions. For gender differences in these positions, we refer to the “Power Gap.”

We see that among the 46% of employees who hold personnel responsibility, women are in the minority compared to men. The share of women with personnel responsibility amounts to 13% of the management positions, compared to 33% among men. This means that within positions with personnel responsibility, women account for 28%.

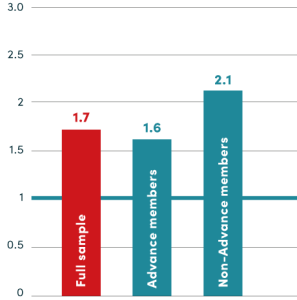
The “Power Index” denotes the gender distribution in positions with personnel responsibility compared to the gender distribution in the overall workforce. The higher this index is, the more underrepresented women are in positions with real influence and decision-making power.
The Power Index shows there is still a way to go until women are equally represented in power positions. Advance members do better than non-Advance members when elevating women into influential positions. Between 2024 and 2025, the Power Index for the full sample has not changed.
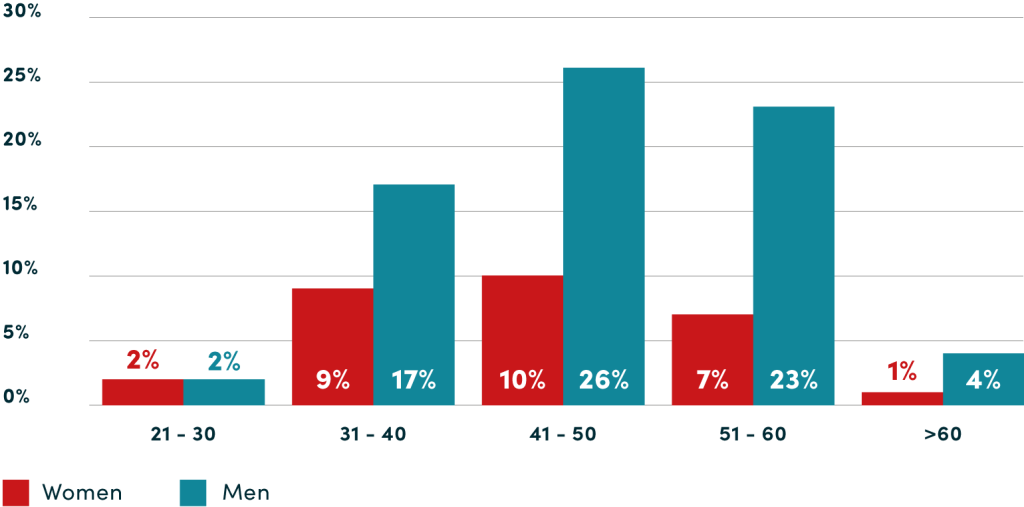
Starting at age 30, a power gap emerges between women and men. The higher the age group, the larger the factor indicating how much more likely men are to have personnel responsibilities compared to women. For example, 30% of employees with personnel responsibility are between 51 and 60 years old: 23% men and 7% women. This means that in this age group, men are more than three times as likely as women to be in power positions.
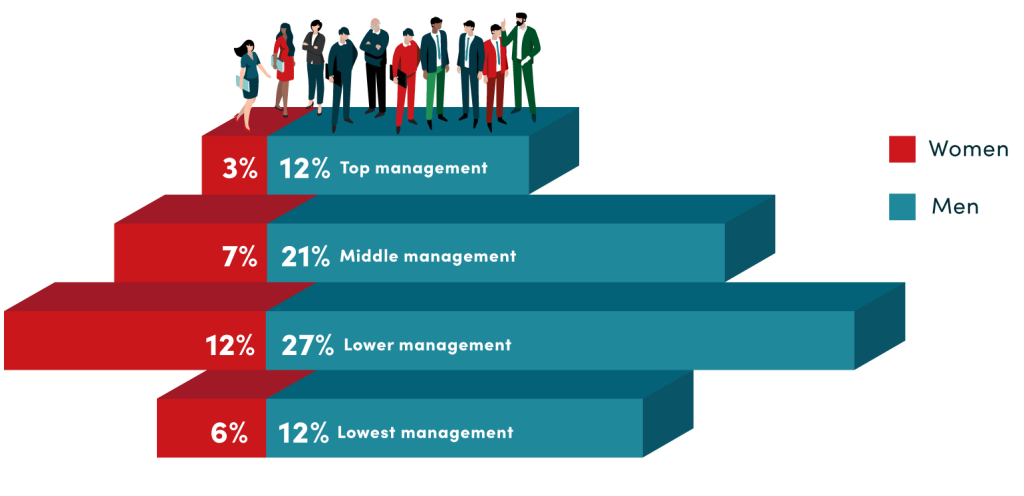
This power gap is also clearly visible when analyzing the distribution of positions with personnel responsibility across hierarchy levels. As with age groups, the above-mentioned factor increases with higher levels of hierarchy. Sixteen percent of employees with personnel responsibility are in top management, and four fifths of them are men. In the lowest and lower management positions, women are better represented. In the lowest management positions, women account for one third, and in the lower management positions, 30%.