Again this year, we present the GIR Key Figures section. These key figures will be your constant companion through each year’s GIR.

A look at the gender distribution at all management levels shows that participating companies still have a long way to go regarding gender parity in the workplace.
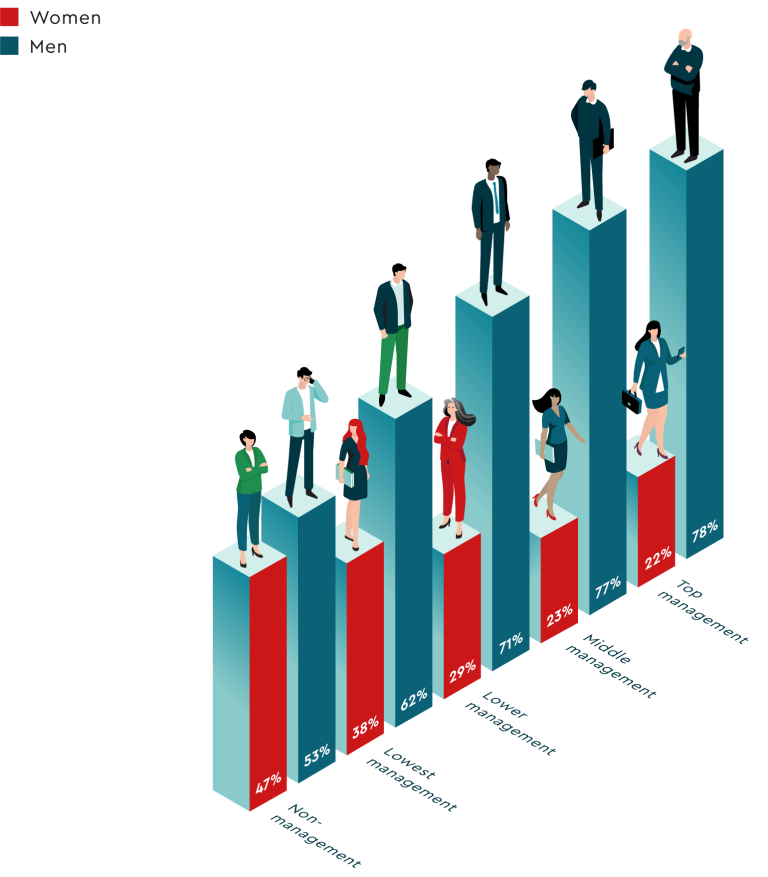
The leaky pipeline, where women are (nearly) equally represented in non-management yet barely represented in top management positions, has been a fixture in the Gender Intelligence Report every year. 2024 is no exception. Although women hold 47% of non-management positions, they are only represented at 22% in top management.
To show progress over time and allow for accurate comparability, we created a sub-sample of 71 companies with 305,600 employees’ HR data from companies that participated in the report in both 2023 and 2024.
Top management
+1 percentage points
Middle management
+1 percentage point
Lower management
+2 percentage points
Lowest management
0 percentage points
Management overall
+1 percentage point
Looking at all management levels, the percentage of women increased by one percentage point between 2023 and 2024. Looking at the different management levels, we can see that the share of women did not change in the lowest management, increased by two percentage points in lower management and by one percentage point in middle management and in top management. This means there is very minimal progress.
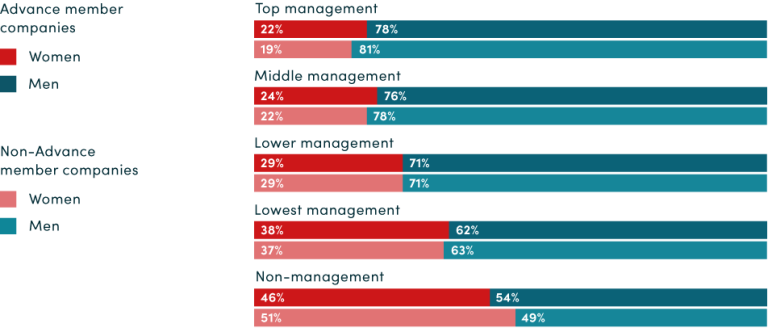
In 2024, Advance members still do better than non-Advance members regarding the share of women at each management level, except for lower management. In top management, women at Advance member companies represent 22% of the total and only 19% in non-Advance companies. However, the pattern is the same in all companies, and the share of women decreases at each management level.
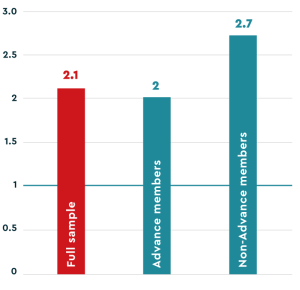
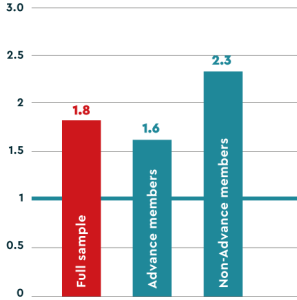
The Glass Ceiling Indey (GCI) shows that across the board, women are underrepresented in middle and top management positions. This is considerably more pronounced in non-Advance than Advance companies.
When looking at the development between 2023 and 2024, there is very limited improvement in the glass ceiling index, it decreased by 0.2.
If women are represented in similar proportions across all hierarchy levels they can reach management positions without significant hurdles. The Glass Ceiling Index compares the gender distribution in management (or at a specific management level) with the gender distribution in the overall workforce. A Glass Ceiling Index of 2 would indicate that the overrepresentation of men at a particular management level doubles. If men are represented at a ratio of 1:1.5 in the overall workforce (e.g., 40% to 60%), then at a specific management level, men are represented at a ratio of 1:3 (e.g., 25% to 75%).
A GCI of 1 is optimal and means that the gender distribution at a given management level is the same as in the overall workforce. This optimal value means no female talent is lost on the way up. If the index is above 1, women are underrepresented (compared to their share of the total workforce). The higher the value, the thicker the Glass Ceiling and the more pronounced the overrepresentation of men. If the index is above 1, improvement is shown as a decrease in the index value.
While each industry has different starting points, unique challenges, and specific cultural traits, the Glass Ceiling Index indicates how well a sector uses its diversity pipeline potential via promotions and recruitment.
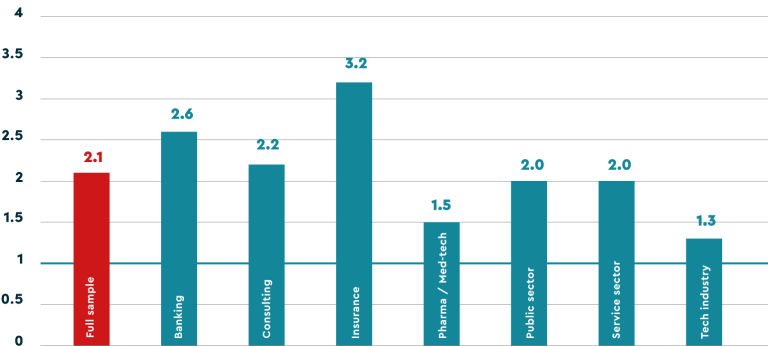
The two industries with the best Glass Ceiling Index – Tech industry and Pharma/Med-tech – leverage their female pipeline potential very well through both hires and promotions. Moreover, they have anchored inclusion and diversity in their corporate strategy, recognizing their interconnectedness. They emphasize the importance of inclusive leadership, making it a cornerstone of their leadership development. Consequently, they have implemented inclusion goals for managers, measured by their employees’ inclusion perception. Lastly, they care about discovering why employees leave by systematically conducting and analyzing exit interviews.
In addition to the GCI, the “Power Index” denotes the gender distribution in positions with personnel responsibility compared to the gender distribution in the overall workforce. The higher this index is, the more underrepresented women are in positions with real influence and decision-making power.
The Power Index shows there is still a way to go until women are equally represented in power positions. Like for the GCI, Advance members do better than non-Advance members when elevating women into influential positions. Between 2023 and 2024, the Power Index has also decreased very slightly by 0.1 points.